OSHAWA REAL ESTATE MARKET REPORT · As of September 22, 2026What 717 Active Listings Tell Buyers, Sellers & Investors in Oshawa Right NowLive. Work. Invest. Belong. Local market insight,

Dated: September 22 2026
Views: 0
Live. Work. Invest. Belong. Local market insight, real results.
As of September 22, 2026, Oshawa has 717 active listings, averaging $783,747 with a median asking price of $719,999. Homes are taking 46 days on average to sell (33 median), giving buyers real choice and time to compare.
Inventory is concentrated between $600K–$800K (about 34% of listings), detached homes make up 63% of active inventory, and attached row townhouses show the longest exposure at 51 median days on market — a segment worth watching closely for negotiating opportunities.
Note: this is an active-listing snapshot, not a completed-sales report — the figures below are asking prices, not sold prices. Call 437-444-4442 for a personalized comparison in your price range.
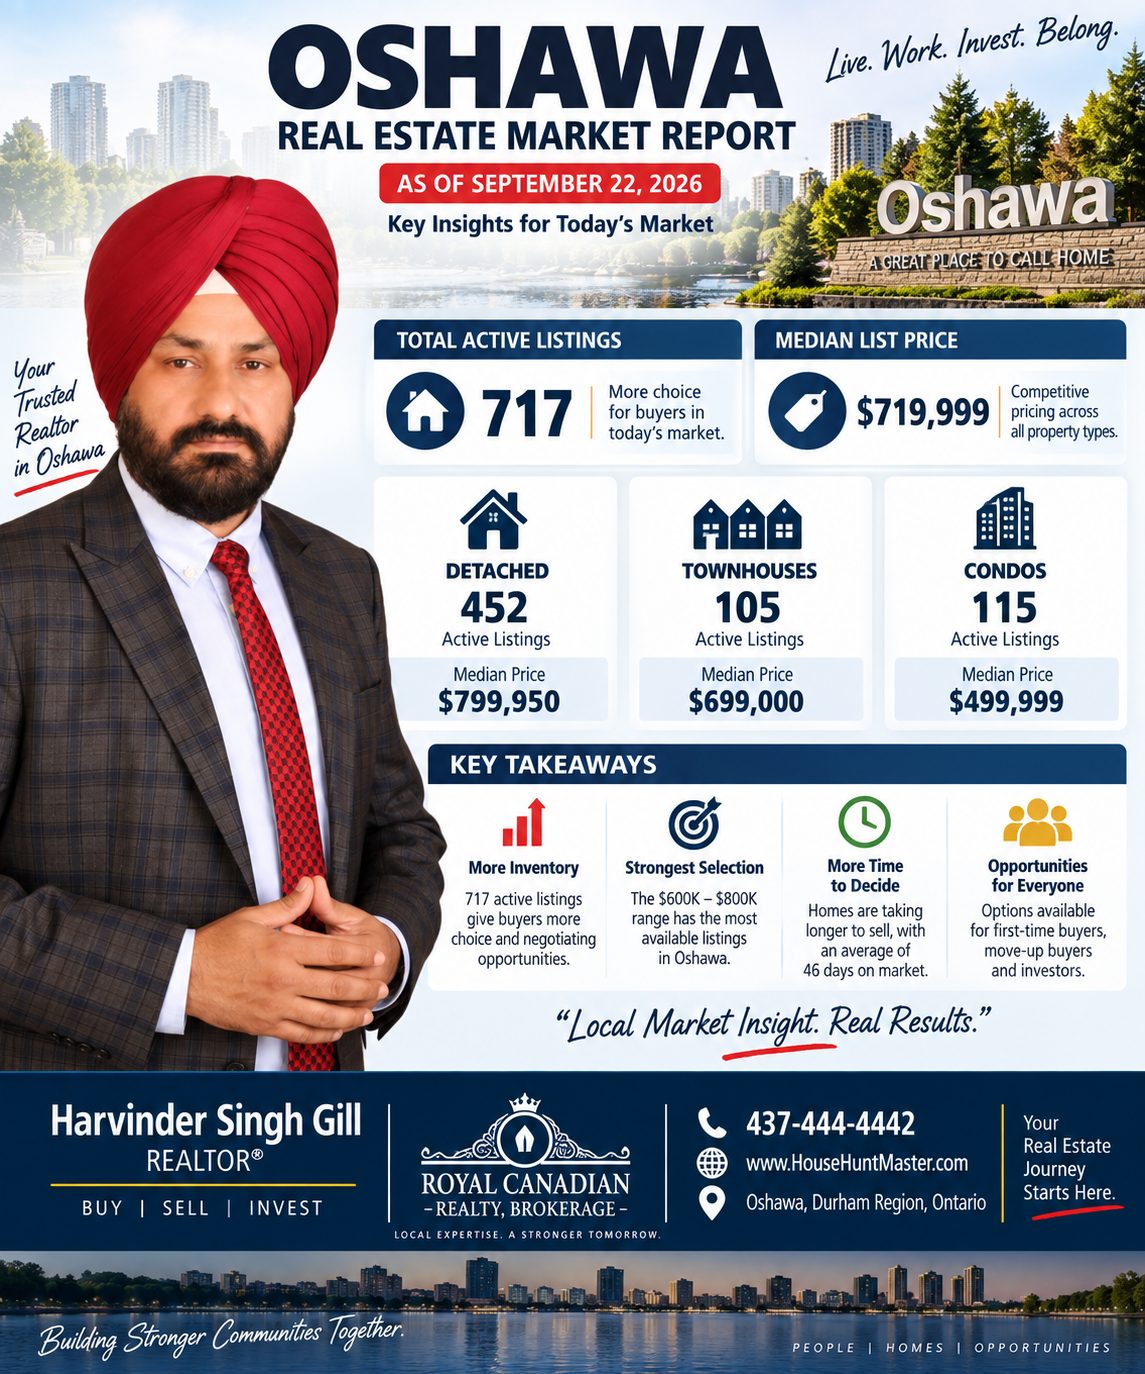
I reviewed all six Oshawa market snapshots for this update: overall market, detached, semi-detached, freehold/attached row townhouses, condo townhouses and condo apartments.
One important distinction: these are active-listing snapshots, not completed-sales reports. The prices below are asking/list prices, not sold prices, and days-on-market (DOM) refers to current active inventory still on the market.
As of the September 21/22 snapshot, Oshawa had 717 active listings in the selected range, with an average asking price of $783,747 and a median asking price of $719,999. The typical active listing has been exposed to the market for a meaningful period: average DOM is 46 days, while median DOM is 33 days.
The composition of inventory is particularly important: 63% of the selected active listings are detached homes. Condo apartments account for about 9%, attached row townhouses about 8%, condo townhouses about 7%, with the balance in other property types.
| Property Type | Active | Avg. List Price | Median List Price | Avg. DOM | Median DOM |
|---|---|---|---|---|---|
| Detached | 452 | $877,206 | $799,950 | 44 | 30 |
| Semi-detached | 41 | $672,407 | $640,000 | 45 | 20 |
| Attached row townhouse | 54 | $689,372 | $699,000 | 53 | 51 |
| Condo townhouse | 51 | $510,443 | $499,999 | 43 | 27 |
| Condo apartment | 64 | $450,386 | $412,500 | 49 | 41 |
| All property types | 717 | $783,747 | $719,999 | 46 | 33 |
One of the strongest signals in the overall snapshot is where inventory is concentrated. There are 135 active listings between $600,000 and $699,999 and another 109 between $700,000 and $799,999. That means roughly 244 active properties — about 34% of the 717 selected listings — are concentrated between $600K and $800K.
That's an important search range for buyers. It doesn't mean every seller in this bracket will negotiate, but buyers looking around $600K–$800K have considerable choice, which makes property-by-property comparison important.
There are 452 detached homes for sale, representing approximately 63% of the selected Oshawa inventory. The average detached asking price is $877,206, while the median is considerably lower at $799,950. The price distribution tells us even more:
Buyer takeaway: the detached market isn't one market. Someone shopping around $650,000 faces a very different property pool from someone shopping at $950,000 or $1.1 million. The 25th-percentile detached asking price is $679,813, meaning roughly one-quarter of this selected inventory is listed at or below approximately that level. For first-time buyers who automatically assume a detached Oshawa home is outside their budget, this segment is worth examining based on actual condition, neighbourhood, renovation requirements and financing — not the city-wide average alone.
The semi-detached snapshot is relatively small — just 41 active listings, averaging $672,407 with a median of $640,000 (25th percentile $599,900, 75th percentile $699,900). Most notably, median DOM is only 20 days, although average DOM is 45 days — a gap suggesting the inventory isn't behaving uniformly, with some properties sitting much longer while others are much newer to market.
The largest concentration is clear: 19 semi-detached listings are between $600K and $699K, with another 12 between $500K and $599K. For buyers who want more traditional ground-oriented housing but don't necessarily need a detached property, $500K–$700K is currently a key semi-detached search band.
This is one of the most interesting findings across the six reports. Oshawa has 54 active attached row townhouses, averaging $689,372 with a median of $699,000. Average DOM is 53 days and median DOM is 51 days — the highest median DOM among the five property categories supplied.
Inventory is heavily concentrated: 21 listings between $600K–$699K and 21 between $700K–$799K. Together, those two bands represent 42 of 54 active attached-row listings — about 78% of this inventory.
A listing on the market for 50+ days doesn't automatically mean the seller will accept a major discount, but longer exposure gives buyers useful information — this is where a targeted CMA becomes more valuable than simply looking at the asking price.
There are 51 active condo townhouses, averaging $510,443 with a median of $499,999. Average DOM is 43 days, but median DOM is considerably shorter at 27 days. The inventory is concentrated around the middle: 18 listings between $400K–$499K and 21 between $500K–$599K — that's 39 of 51 listings, or approximately 76%, between $400K and $600K.
For buyers comparing a $500K condo townhouse against a $650K–$700K freehold alternative, purchase price alone shouldn't determine the decision. The comparison should include: mortgage payment + condo fee + property tax + insurance + maintenance responsibility + available space + resale considerations.
The condo-apartment report shows 64 active units, averaging $450,386, though the median is only $412,500 (25th percentile $367,975, 75th percentile $499,923). Inventory is concentrated below $500K: 11 units between $200K–$299K, 19 between $300K–$399K, and 19 between $400K–$499K. So 49 of 64 active condo apartments — roughly 77% — are listed below $500,000.
First-time buyer takeaway: for buyers whose main obstacle is purchase price, the condo segment deserves attention. But a $400,000 condo isn't necessarily "more affordable" than its purchase price suggests — buyers need to add the monthly condo fee and understand what it covers, review the corporation's financial position or status certificate as appropriate, and compare total carrying costs against alternative property types.
Oshawa currently offers substantial active inventory and meaningful choice, but the opportunity differs sharply by property type and price range.
The 46-day average DOM across all properties tells us that much of the inventory is not disappearing immediately. But it would be misleading to turn that into "everything is negotiable" — semi-detached homes have a 20-day median DOM, compared with 51 days for attached row townhouses. That's why buyers and sellers should look at their actual segment, rather than a single Oshawa-wide statistic.
This snapshot gives buyers three useful advantages: choice, time to compare, and the ability to identify stale inventory. Instead of asking only "how much is the seller asking?", ask: How long has it been listed? What are comparable properties asking? What have comparable homes actually sold for? Has the property already had a price reduction? How much competing inventory exists in the same price bracket?
For a first-time buyer, the most interesting entry points in this active inventory appear to be condo apartments below $500K, condo townhouses around $400K–$600K, semis around $500K–$700K, and selected detached properties in the $600K–$800K range. These are observations from active inventory — not predictions about where prices will go next.
With 717 active listings and an overall median asking price of $719,999, buyers have alternatives — making the first few weeks of a listing particularly important. A seller shouldn't base today's asking price simply on "my neighbour listed for $800,000." An active listing is competition, not proof of market value.
For example, an attached-row townhouse entering a segment where the median active listing has already accumulated 51 days on market needs particularly careful positioning.
Investors have an interesting market to analyze because longer DOM and substantial inventory can create more time for due diligence. But discount does not equal investment return. An investor should calculate: Acquisition Price → Financing → Property Tax → Insurance → Repairs → Condo Fees if applicable → Expected Rent → Vacancy → Maintenance → Cash Flow → Exit Strategy.
This snapshot can help identify where supply is concentrated, but these reports do not provide rental income, sold-price data or investment returns, so those conclusions shouldn't be inferred from this dataset alone. For investors, I'd pay particular attention to properties with longer-than-segment DOM, multiple price reductions, renovation potential and significant direct competition — then run the numbers individually.
More choice, more time, and the ability to spot stale inventory before making an offer.
More due-diligence time, but discount alone doesn't equal return — the numbers still have to work.
Price against today's competition, not yesterday's expectations or your neighbour's ask.
The most useful numbers to remember: 717 active listings | $783,747 average asking price | $719,999 median asking price | 46 average DOM | 33 median DOM. But the deeper story is the segmentation — Detached: $799,950 median asking. Semi: $640,000. Freehold/attached townhouse: $699,000. Condo townhouse: $499,999. Condo apartment: $412,500. The strongest buyer-choice zone in the overall inventory is currently around $600K–$800K.
For buyers, that means compare before you offer. For sellers, price against today's competition — not yesterday's expectations. For investors, calculate the return, not just the discount.
Q. How many active listings are there in Oshawa right now?
As of September 22, 2026, Oshawa has 717 active listings across all property types, averaging $783,747 with a median asking price of $719,999.
Q. Is Oshawa still a good market for first-time buyers?
Yes. With 717 active listings and inventory heavily concentrated between $400,000 and $800,000 across condo apartments, condo townhouses, semi-detached homes and select detached properties, first-time buyers currently have meaningful choice and time to compare rather than facing a single rushed decision.
Q. What is the cheapest property type to buy in Oshawa right now?
Condo apartments are the lowest-priced major segment, with a median asking price of $412,500 and about 77% of the 64 active units listed below $500,000.
Q. Which Oshawa property type is taking the longest to sell?
Attached row townhouses currently show the longest exposure, averaging 53 days on market with a median of 51 days — the highest median DOM of the categories reviewed.
Q. What price range has the most homes for sale in Oshawa?
The $600,000 to $800,000 range is the heart of current inventory, with roughly 244 of 717 active listings (about 34%) concentrated in that band.
Q. Can first-time buyers afford a detached home in Oshawa?
Some can. While the average detached asking price is $877,206, the median is lower at $799,950, and the 25th percentile is approximately $679,813 — meaning roughly a quarter of active detached listings sit at or below that level.
Q. Should sellers price based on their neighbour's listing price?
No. An active listing is competition, not proof of market value. Compare recent sold properties, active competitors, expired/terminated listings, condition, location, property type, current DOM and prior price reductions instead.

About Harvinder Gill – Trusted Real Estate Agent in Markham & Durham RegionI’m Harvinder Gill, a professional Real Estate Agent with Royal Canadian Realty, Brokerage, based in Markham ....
OSHAWA REAL ESTATE MARKET REPORT · As of September 22, 2026What 717 Active Listings Tell Buyers, Sellers & Investors in Oshawa Right NowLive. Work. Invest. Belong. Local market insight,
OSHAWA & DURHAM REGION REAL ESTATE · September 17, 2026Fed Raises Rates... Will the Bank of Canada Follow? What It Could Mean for Home Buyers, Sellers and InvestorsSame market. Smarter
NEWMARKET, ONTARIO · Investor & Renovator ListingInvestor & Renovator Special in Newmarket: Great Potential in a Prime LocationRenovate. Reimagine. Add Value. A spacious detached
OSHAWA FIRST-TIME BUYER GUIDE · Week of September 14, 20267 Things Oshawa First-Time Home Buyers Are Asking This WeekReal buyer stories, honest rate advice, a free checklist and a process
 Toronto Real Estate Board (TRREB); All information deemed reliable but not guaranteed. All properties are subject to prior sale, change or withdrawal. Neither listing broker(s) or information provider(s) shall be responsible for any typographical errors, misinformation, misprints and shall be held totally harmless. Listing(s) information is provided for consumer's personal, non-commercial use and may not be used for any purpose other than to identify prospective properties consumers may be interested
in purchasing. The data relating to real estate for sale on this website comes in part from the Internet Data Exchange program of the Multiple Listing Service. Real estate listings held by brokerage firms other than Royal Canadian Realty, Brokerage, Markham may be marked with the Internet Data Exchange logo and detailed information about those properties will include the name of the listing broker(s) when required by the MLS. Copyright ©2026 All rights reserved.
Last Updated: September 22, 2026 1:03 AM UTC
Show More...
Toronto Real Estate Board (TRREB); All information deemed reliable but not guaranteed. All properties are subject to prior sale, change or withdrawal. Neither listing broker(s) or information provider(s) shall be responsible for any typographical errors, misinformation, misprints and shall be held totally harmless. Listing(s) information is provided for consumer's personal, non-commercial use and may not be used for any purpose other than to identify prospective properties consumers may be interested
in purchasing. The data relating to real estate for sale on this website comes in part from the Internet Data Exchange program of the Multiple Listing Service. Real estate listings held by brokerage firms other than Royal Canadian Realty, Brokerage, Markham may be marked with the Internet Data Exchange logo and detailed information about those properties will include the name of the listing broker(s) when required by the MLS. Copyright ©2026 All rights reserved.
Last Updated: September 22, 2026 1:03 AM UTC
Show More...

The listing data displayed is deemed reliable but is not guaranteed accurate by CREA®. Data last updated on September 22, 2026 1:41 AM UTC The trademarks REALTOR®, REALTORS®; and the REALTOR® logo are controlled by The Canadian Real Estate Association (CREA®) and identify real estate professionals who are members of CREA®. Used under license. The trademarks MLS®, Multiple Listing Service® and the associated logos are owned by The Canadian Real Estate Association (CREA®) and identify the quality of services provided by real estate professionals who are members of CREA®. Used under license.
Show More...