OSHAWA REAL ESTATE MARKET REPORT · As of September 22, 2026What 717 Active Listings Tell Buyers, Sellers & Investors in Oshawa Right NowLive. Work. Invest. Belong. Local market insight,

Dated: October 8 2025
Views: 569
What's Really Happening Across the GTA, Hamilton, and Waterloo Region Professional Analysis by Harvinder Singh Gill | Royal Canadian Realty
 Executive Summary: Market Dynamics & Key Insights
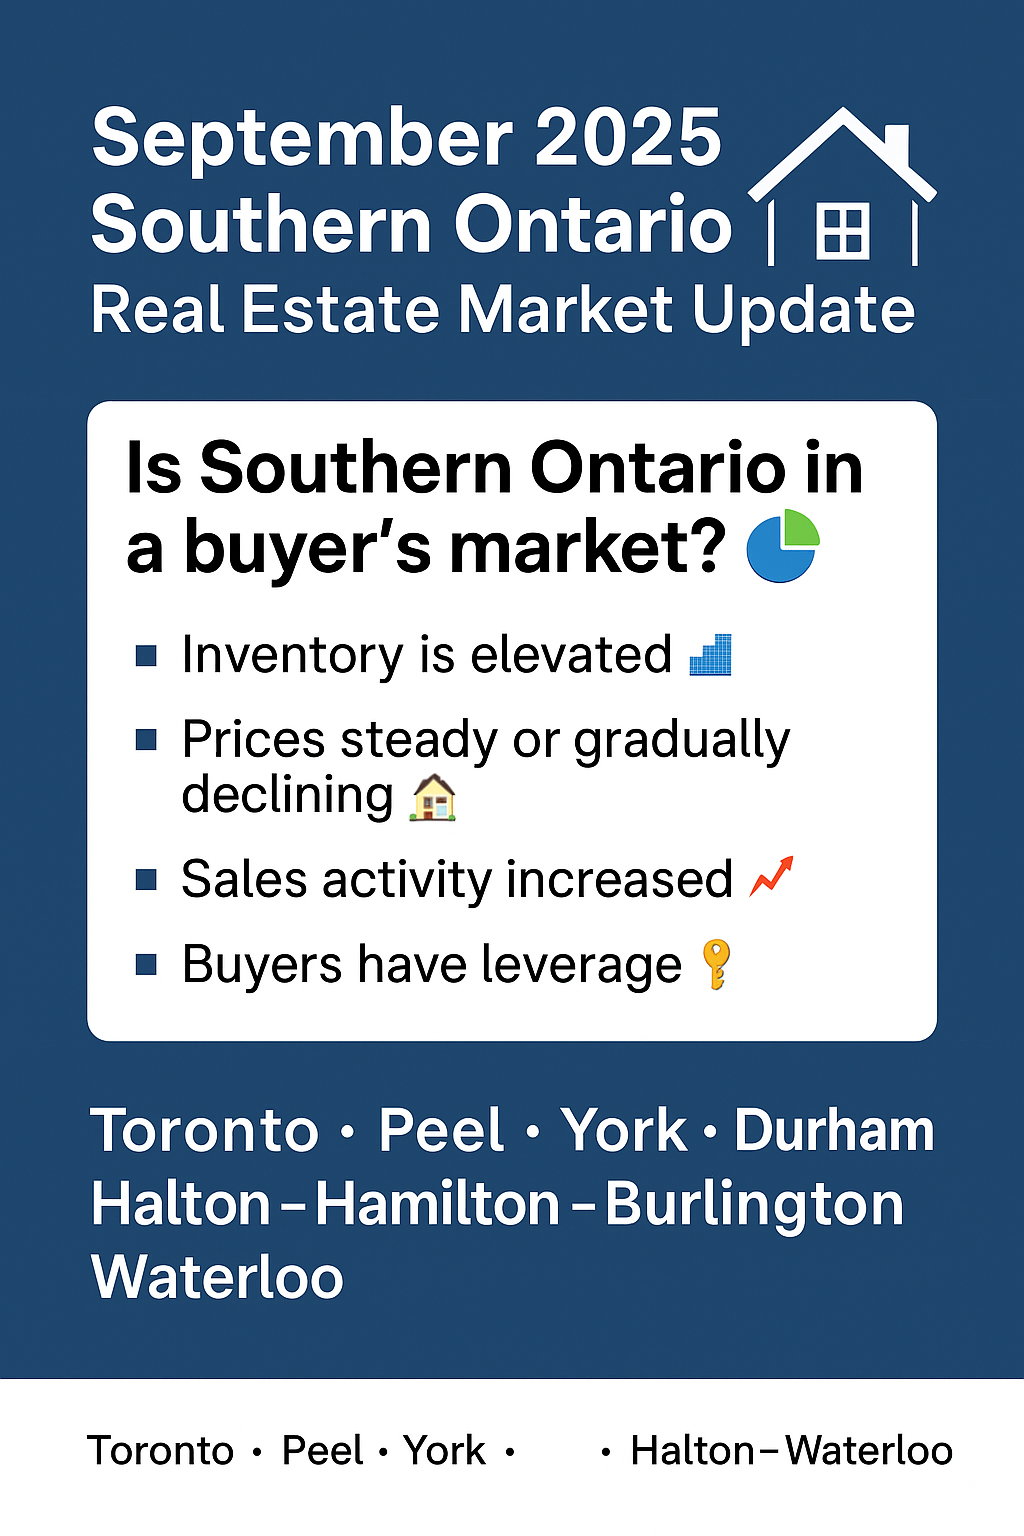
Southern Ontario's market conditions in September 2025 largely favor buyers or suggest a balanced environment. Inventory rose significantly across all regions, giving buyers greater choice and leverage. While prices trended downward in most markets, declines remained measured—approximately 4-5% year-over-year in the GTA and Waterloo, and up to 10% in parts of Hamilton-Burlington. Importantly, this represents a market correction rather than a crash, with high-quality, well-located properties retaining resilience.
GTA Average Price: $1,059,377 (↓ 4.7% year-over-year)
TRREB MLS® Home Price Index (HPI) Composite: Down 5.5% year-over-year
Waterloo Region Average: $753,162 (↓ 4.7% YoY, ↑ 3.2% month-over-month)
Hamilton-Burlington Average: $754,000 (↓ 10.3% year-over-year)
All major housing types experienced price declines year-over-year, though micro-neighborhoods in core Toronto and select suburbs posted flat or slight month-over-month gains, indicating pockets of resilience.
Sales grew in most regions as buyers responded positively to the Bank of Canada's September rate cut and greater property selection. However, increased inventory continues to provide buyers with negotiating leverage. The rate cut has stimulated renewed buyer interest, particularly among first-time buyers who had been waiting on the sidelines, but it hasn't fully reversed the buyer-favorable conditions created by elevated supply levels.
Most Southern Ontario markets present buyer-leaning or balanced conditions this fall. Prices are mildly down, but sales are rising and listings remain abundant. Savvy buyers can negotiate favorable terms, while sellers succeed only with realistic, data-driven pricing strategy and professional presentation.
Data Sources: All statistics and market analysis drawn from Toronto Regional Real Estate Board (TRREB), Waterloo Region Association of REALTORS® (WRAR), Realtors Association of Hamilton-Burlington (RAHB), Cornerstone Real Estate Advisors, and OntarioMLP publications.
Understanding local market dynamics is essential for making informed real estate decisions. Below is a granular analysis of each Southern Ontario subregion, including sales volume, average prices, year-over-year trends, and strategic insights for buyers and sellers.
| Metric | Value/Trend | Commentary |
|---|---|---|
| Sales Volume | 2,063 units | From TRREB regional breakdown |
| Average Price | $1,089,918 | TRREB City of Toronto data |
| YoY Price Change | ↓ 4-6% | Downward pressure, some condo resilience |
| Days on Market | Elevated vs. prior year | Mirrors GTA trend of 22.2% increase |
| Key Neighborhoods | East York, Scarborough, Riverside, Seaton Village, Willowdale | |
| Metric | Value/Trend | Commentary |
|---|---|---|
| Total Sales | 996 units | TRREB Peel Region data |
| Average Price | $959,313 | Regional average |
| Median Price | $881,250 | TRREB data point |
| Inventory Trend | Increasing | More choice for buyers |
Mississauga: Higher-end segments demonstrate more resilience with steady demand for properties near transit hubs and employment centers. Buyers have expanded selection but quality properties still attract multiple offers.
Brampton: Inventory growth is particularly noticeable, with stronger price pressure on detached homes. This creates excellent value opportunities for first-time buyers and young families. Semi-detached and townhouse segments offer the best value propositions.
| Metric | Value/Trend | Commentary |
|---|---|---|
| Sales Volume | 1,032 units | TRREB York Region |
| Average Price | $1,180,765 | Regional average |
| Supply Trend | Growing | Expanded buyer options |
Strategic Insight: York Region offers diverse opportunities across price points. Focus on transit-accessible areas and mid-market products for best value and liquidity.
| Metric | Value/Trend | Commentary |
|---|---|---|
| Sales Volume | 707 units | TRREB Durham data |
| Average Price | $877,963 | Most affordable GTA region |
| Buyer Profile | Entry buyers and families, especially in Oshawa and Ajax | |
| Supply Constraints | Easing | Improved choice for buyers |
Data Note: Halton is included in TRREB's composite data; micro-level public data is less detailed in free summaries, but market intelligence provides valuable insights.
Halton continues to be one of the stronger subregions in the GTA, with detached homes still commanding premiums due to relative scarcity and strong demand fundamentals. However, even this traditionally resilient market is experiencing price sensitivity in outer areas.
Oakville & Burlington:
Milton & Halton Hills:
Buyers: Consider Milton and Burlington for best value; Oakville for premium lifestyle and long-term appreciation potential.
Sellers: Invest in professional presentation and strategic pricing, even in traditionally strong markets.
| Metric | Value/Trend | Commentary |
|---|---|---|
| Average Price | $754,000 | RAHB/Cornerstone/OntarioMLP |
| YoY Change | ↓ 10.3% | Steepest decline in Southern Ontario |
| Inventory Status | Elevated | Significant negotiation opportunities |
According to RAHB data and OntarioMLP coverage, home sales and prices in Hamilton-Burlington have been pressured by economic uncertainty. Inventory is elevated, and sellers are under more negotiation stress than in other regions.
| Metric | Value | YoY Change | MoM Change |
|---|---|---|---|
| Sales Volume | 502 homes | ↓ 4.7% | — |
| Average Price | $753,162 | ↓ 4.7% | ↑ 3.2% |
| Active Listings | 2,094 | ↑ 22.2% | — |
| Months of Supply | 4.0 months | — | — |
| Avg Days to Sell | 32 days | ↑ from 28 | — |
| Property Type | Sales | Average Price | YoY Change | MoM Change |
|---|---|---|---|---|
| Detached | 325 | $858,872 | ↓ 5.9% | ↑ 1.4% |
| Townhouse | --- | $606,871 | ↓ 1.7% | ↑ 1.8% |
| Semi-Detached | — | $621,026 | ↓ 5.1% | ↑ 0.5% |
| Condo Apartment | — | $442,086 | ↓ 8.9% | ↑ 2.0% |
Market Balance: The Waterloo Region is showing signs of stabilization with month-over-month price increases for detached, townhouses, and semi-detached homes—suggesting the worst of the correction may be behind us.
Condo Segment: Under the most pressure in Waterloo, with 7.3 months of supply creating exceptional opportunities for buyers and investors focused on long-term rental income.
Buyer Advantage: More choice and negotiating power, especially in the condo and townhouse segments.
Seller Strategy: Must respond with realistic pricing, professional staging, and strategic marketing. Properties that show well and are priced competitively are still selling within reasonable timeframes.
Data Source: Waterloo Region Association of REALTORS® (WRAR) / Cornerstone Real Estate Advisors, September 2025
Understanding how each housing type is performing across Southern Ontario is essential for strategic decision-making. Below is a comprehensive comparative summary drawn from TRREB, WRAR, and Cornerstone data.
| Metric | Value | YoY Change |
|---|---|---|
| Average Price | $1,059,377 | ↓ 4.7% |
| New Listings | 19,260 | ↑ 3.9% |
| Active Listings | 29,394 | ↑ 18.9% |
| Listing Days (LDOM) | 33 days | ↑ 22.2% |
| Property Days (PDOM) | 51 days | ↑ 21.4% |
| Type | GTA Avg | YoY % | Toronto | Peel | York | Durham | Waterloo |
|---|---|---|---|---|---|---|---|
| Detached | $1,359,030 | ↓ 0.8% | $1,686K | $1,173K | $1,181K | $929K | $858,872 |
| Semi-Detached | $1,181,672 | ↓ 5.4% | $1,015K | $986K | $1,111K | $807K | $621,026 |
| Townhouse | $1,015,543 | ↓ 6.1% | $1,213K | $987K | $1,181K | $789K | $606,871 |
| Condo Apt | $655,231 | ↓ 8.9% | $685K | $573K | $702K | $598K | $442,086 |
Market Position: Detached homes remain the priciest in all regions but face the sharpest downward pressure in outlying and suburban markets due to higher cost burden for buyers.
Best Value: Durham ($929K) and Waterloo ($859K) offer exceptional value compared to GTA core pricing.
Outlook: Expect continued pressure in higher-priced markets, with best opportunities in well-located properties near transit and employment centers.
Sweet Spot Segment: These property types are holding relatively better, offering a cost-advantaged middle ground between detached homes and condos.
Regional Standouts: Towns and semis near transit in Peel, York, and Waterloo present outstanding mid-market value.
Waterloo Advantage: Townhouses in Waterloo actually posted slight year-over-year gains in some micro-markets.
Buyer Strategy: Excellent entry points for first-time buyers and young families seeking space and value.
Maximum Pressure: Condominiums (especially apartment-style) are under the most stress, particularly in suburban and secondary markets.
Exceptions: Downtown cores and transit-proximate zones remain relatively stronger.
Inventory Expansion: Most pronounced in condominium supply—meaning buyers have the largest margin of choice and negotiating power here.
Investment Opportunity: For long-term investors, current pricing may represent attractive entry points, especially in areas with strong rental demand.
In early September 2025, the Bank of Canada cut its policy rate by 25 basis points—a significant move after a period of relative stability. This was widely seen as a trigger for renewed buyer activity.
Not entirely. The rate cut provided relief and stimulated activity, but it's one of several factors. Inventory levels, affordability constraints, and consumer confidence continue to mediate how strong the rebound is. The market remains buyer-leaning despite increased sales activity.
No. Some areas, especially core GTA and premium neighborhoods, still experience scarcity. Other areas, especially exurbs and secondary markets (Waterloo, Hamilton, outer Durham), are seeing more substantial supply growth, creating divergent market conditions.
| Stakeholder | Observed Behavior | Market Implication |
|---|---|---|
| Buyers | More active after rate cut, but cautious on price; "wait-and-see" still common in high-end markets | Increasing competition in mid/entry segments; less in premium brackets |
| Sellers | More realistic pricing, willingness to negotiate; listings now require sharper presentation | Overpriced homes linger; staging, pre-inspection, cosmetic upgrades matter significantly |
| Investors | More selective, focusing on strong rental corridors, multi-unit, or purpose-built opportunities | Some investor capital re-calibrating away from speculative condo flipping |
| Realtors/Agents | Emphasis on ultra-local data, pricing strategy, and marketing (staging, virtual tours) | Agents who bring insight and differentiation win more listings |
Based on current market dynamics and expert analysis, here are data-backed projections for the remainder of 2025.
Expected Growth: Modest sales increases in October and November—on the order of 3-8% over same months in 2024, as rate relief and buyer activity continue
Seasonal Patterns: Some cooling may begin in December, but 2025 could outperform 2024 if rates remain stable or soften further
Regional Variation: Stronger performance expected in mid-market segments and transit-oriented communities
Prices will likely hold stable to slightly lower (1-2%) in many markets over Q4 2025, especially in detached segments
Yes—this is among the better windows in recent years to find value and negotiate favorably. High inventory, motivated sellers, and improved interest rates create optimal conditions for informed buyers. Focus on:
Only if you adopt a disciplined, data-based strategy. Overpriced listings will languish in current conditions. Success requires:
Focus on fundamentals—rental demand, location, and unit mix will matter more than speculative appreciation. Best opportunities:
In a market like September 2025—characterized by shifting leverage, segmented behavior, and heightened buyer expectations—clients need more than just a salesperson. They need a strategist.
Harvinder monitors TRREB, WRAR, RAHB, Cornerstone, and OntarioMLP data daily. He produces micro-neighborhood analytics (street-level comps, absorption rates) to guide pricing strategies. In September's market, that means identifying which pockets still command premium pricing vs. which are under pressure.
In buyer-leaning environments, Harvinder advises clients on conditional offers, escalation clauses, and inspection negotiation tactics. For sellers, he uses data-backed pricing, timed offers, and competitive presentation to reduce listing days and preserve price integrity.
For Buyers: Align purchase strategy with budget sensitivity, interest-rate risk, and long-term goals.
For Sellers: Craft customized marketing (staging, renovations, timing, incentives) to make your listing shine in a competitive inventory pool.
Leverage digital campaigns (virtual tours, targeted social media, drone/Matterport scans) to maximize exposure. Present transparent transaction dashboards, keeping clients updated on market feedback, traffic, and offer strategy.
In shifting markets, stress and surprises arise. Harvinder emphasizes proactive communication, scenario planning, and backup strategies. He positions clients not just to transact, but to make choices aligned with their financial and lifestyle goals.
Because inventory is high and buyer leverage stronger, having a skilled agent who can read market pivots is more essential than ever. From staging budgets to negotiation thresholds, every decision counts in 2025—Harvinder's precision makes the difference.
Phone: 437-444-4442
Email: hgill@royalcanadianrealty.com
Website: www.househuntmaster.com
Unit 1 - 2896 Slough St
Mississauga, ON L4T 1G3
Serving Peel Region & West GTA
Suite 206 - 3 Centre St
Markham, ON L3P 3P9
Serving York Region, Durham Region & North/East GTA
Suite 2B - 625 King St E
Kitchener, ON N2G 2M2
Serving Waterloo Region
Suite 300 - 163 Centennial Pkwy N
Hamilton, ON L8E 1H8
Serving Hamilton-Burlington Area

About Harvinder Gill – Trusted Real Estate Agent in Markham & Durham RegionI’m Harvinder Gill, a professional Real Estate Agent with Royal Canadian Realty, Brokerage, based in Markham ....
OSHAWA REAL ESTATE MARKET REPORT · As of September 22, 2026What 717 Active Listings Tell Buyers, Sellers & Investors in Oshawa Right NowLive. Work. Invest. Belong. Local market insight,
OSHAWA & DURHAM REGION REAL ESTATE · September 17, 2026Fed Raises Rates... Will the Bank of Canada Follow? What It Could Mean for Home Buyers, Sellers and InvestorsSame market. Smarter
NEWMARKET, ONTARIO · Investor & Renovator ListingInvestor & Renovator Special in Newmarket: Great Potential in a Prime LocationRenovate. Reimagine. Add Value. A spacious detached
OSHAWA FIRST-TIME BUYER GUIDE · Week of September 14, 20267 Things Oshawa First-Time Home Buyers Are Asking This WeekReal buyer stories, honest rate advice, a free checklist and a process
 Toronto Real Estate Board (TRREB); All information deemed reliable but not guaranteed. All properties are subject to prior sale, change or withdrawal. Neither listing broker(s) or information provider(s) shall be responsible for any typographical errors, misinformation, misprints and shall be held totally harmless. Listing(s) information is provided for consumer's personal, non-commercial use and may not be used for any purpose other than to identify prospective properties consumers may be interested
in purchasing. The data relating to real estate for sale on this website comes in part from the Internet Data Exchange program of the Multiple Listing Service. Real estate listings held by brokerage firms other than Royal Canadian Realty, Brokerage, Markham may be marked with the Internet Data Exchange logo and detailed information about those properties will include the name of the listing broker(s) when required by the MLS. Copyright ©2026 All rights reserved.
Last Updated: September 22, 2026 1:03 AM UTC
Show More...
Toronto Real Estate Board (TRREB); All information deemed reliable but not guaranteed. All properties are subject to prior sale, change or withdrawal. Neither listing broker(s) or information provider(s) shall be responsible for any typographical errors, misinformation, misprints and shall be held totally harmless. Listing(s) information is provided for consumer's personal, non-commercial use and may not be used for any purpose other than to identify prospective properties consumers may be interested
in purchasing. The data relating to real estate for sale on this website comes in part from the Internet Data Exchange program of the Multiple Listing Service. Real estate listings held by brokerage firms other than Royal Canadian Realty, Brokerage, Markham may be marked with the Internet Data Exchange logo and detailed information about those properties will include the name of the listing broker(s) when required by the MLS. Copyright ©2026 All rights reserved.
Last Updated: September 22, 2026 1:03 AM UTC
Show More...

The listing data displayed is deemed reliable but is not guaranteed accurate by CREA®. Data last updated on September 22, 2026 1:41 AM UTC The trademarks REALTOR®, REALTORS®; and the REALTOR® logo are controlled by The Canadian Real Estate Association (CREA®) and identify real estate professionals who are members of CREA®. Used under license. The trademarks MLS®, Multiple Listing Service® and the associated logos are owned by The Canadian Real Estate Association (CREA®) and identify the quality of services provided by real estate professionals who are members of CREA®. Used under license.
Show More...